November 8, 2011

SharePoint with MicroStrategy

MicroStrategy has introduce SharePoint 2010 web parts for integration in May 2011.
It will support SharePoint 2007 and SharePoint 2010.

Main Feature :

• Displaying toolbars to change views of reports, format, and export data
• Drilling for more details within the web part or to a new window
• Enabling context-sensitive right-click menus
• Performing OLAP manipulations such as sort, pivot, page-by slices of the report, and add new calculations
• Communicating with other MicroStrategy and/or third-party web parts

Here is the link for details…
http://www.microstrategy.com/bi-applications/bydatasource/microsoft/sharepoint.asp

And Here is the blog for Integation with SharePoint from Shiv..
http://shivsquest.blogspot.com/2011/10/sharepoint-with-microstrategy.html

October 5, 2011

Enhanced SharePoint Reporting with the SharePoint Solutions Gallery

OfficeWriter previously integrated with SharePoint, getting solutions up and running used to require quite a bit of coding and configuration on your end. Not so now: they've created two free downloadable plug-and-play solutions: Excel Export Plus and Word Export Plus.

Both consist of custom solutions you install in your SharePoint site that allow you to export list data to Excel and Word.

Excel Export Pro lets you pull the contents of any SharePoint list into a pre-formatted Excel template.

Word Export Pro lets you pull the contents of any item on a SharePoint list into a pre-formatted Word template.
 
For More : Click Here

September 20, 2011

Cloud Connector for Microsoft SharePoint 2010 and Office 365

Hi,

Here is a good tool by Layer2, "Cloud Connector for Microsoft SharePoint 2010 and Office 365".

SharePoint Cloud Connector was specially developed to solve the specific challenges of remote hosted disconnected systems in the cloud without any direct access to corporate business data and very restricted feature customization capabilities.


Please see the video for more information.


July 27, 2011

Configuring Windows and Form Based Authentication in SP-2010

Hi,

Here is good demonstrated video for Configuring Windows and Form based authentication both in SharePoint 2010.

June 28, 2011

Google Chart Tools - Display Live Data on your site.

Hi, I am trying to give one POC (Proof of Concept) to my client, requirment is to show the attractive reports, without any deployment, with only ADMIN rights to one of the SharePoint 2007 site.

I searched a lot and finally decide to go with Google Chart Tools. We can fetch the data from sharepoint list view webpart and can create the chart in SharePoint page using javascript.

Here is the simple example...


and the code to get the above result is..

<div id="chart_div1"></div>
<script type="text/javascript" src="https://www.google.com/jsapi"></script>
<script type="text/javascript">
google.load("visualization", "1", {packages:["corechart"]});
if(typeof jQuery=="undefined"){
var jQPath="http://ajax.googleapis.com/ajax/libs/jquery/1.3.2/";
document.write("<script src='",jQPath,"jquery.js' type='text/javascript'><\/script>");
}
</script>


<script type="text/javascript">
$("document").ready(function(){
google.setOnLoadCallback(drawChart1);
});

function drawChart1() {
var arrayList=$("td.ms-gb:contains('Implemented Solution')");
var coord= new Array();
var labels= new Array();
var titles= new Array();
total=0

$.each(arrayList, function(i,e)
{
var MyIf= $(e).text();
var txt= MyIf.substring(MyIf.indexOf('(')+1,MyIf.length-1); // Extract the ‘Y' coordinates
coord[i]=txt;
total=total+(txt*1)
var txt1= MyIf.substring(MyIf.indexOf(':')+2,MyIf.indexOf("(")-1); // Extract the labels
titles[i]=txt1;
});


for(i=0;i<coord.length;i++)
{
//coord[i]=Math.round((coord[i]/total*100)*10)/10
labels[i]=titles[i]+ coord[i] //"("+coord[i]+"%)"; //update the total
}

var data = new google.visualization.DataTable();
data.addColumn('string', 'Technology Env');
data.addColumn('number', 'Application');
data.addRows(coord.length);

for(i=0;i<coord.length;i++)
{
data.setValue(i, 0, titles[i]);
data.setValue(i, 1, parseInt(coord[i]));
}

var chart1 = new google.visualization.PieChart(document.getElementById('chart_div1'));
chart1.draw(data, {width: 600, height: 440, title: 'Implemented Solution', is3D:true, vAxis: {title: '', titleTextStyle: {color: 'red'}}});
}

</script>

For more Information .... Google Chart Tools

April 29, 2011

Find Web visitor’s Location Automatically with Google APIs

This works great in the United States and has mixed results elsewhere. I’m working to see if I can change that. If your primary customer base is in the US, use this confidently. If your primary customer base is elsewhere, use in development stage only.

Google provides IP address to location translation for FREE! Whenever you use Google’s jsapi script to dynamically load a Google AJAX API, Google automatically populates google.loader.ClientLocation, which has all the juicy details about the web visitor’s location.

We can also add this to SharePoint Portal in Content Editor web part.

Script :

<DIV id='info'> </div>

<script type="text/javascript" src="http://www.google.com/jsapi?key=ABQIAAAAp04yNttlQq-7b4aZI_jL5hQYPm-xtd00hTQOC0OXpAMO40FHAxQMnH50uBbWoKVHwgpklyirDEregg"></script>
<script type="text/javascript">
if(google.loader.ClientLocation)
{
     visitor_lat = google.loader.ClientLocation.latitude;
     visitor_lon = google.loader.ClientLocation.longitude;
     visitor_city = google.loader.ClientLocation.address.city;
     visitor_region = google.loader.ClientLocation.address.region;
     visitor_country = google.loader.ClientLocation.address.country;
     visitor_countrycode = google.loader.ClientLocation.address.country_code;

     document.getElementById('info').innerHTML = '<p>Lat/Lon: ' + visitor_lat + ' / ' + visitor_lon +   '</p><p>Location: ' + visitor_city + ', ' + visitor_region + ', ' + visitor_country + ' (' + visitor_countrycode + ')</p>';
}
else
{
      document.getElementById('info').innerHTML = '<p>Whoops!</p>';
}

</script>


March 19, 2011

PowerPivot videos on Microsoft Technet...

Hi,

I found some good video for implementation of PowerPivot...
It is actually good to get PowerPivot......

PowerPivot Part 1 - Loading Data

PowerPivot Part 2 - Preparing Data

PowerPivot Part 3 - Analysis

PowerPivot Part 4 - Sharing in SharePoint 2010

PowerPivot Part 5 - Management

March 4, 2011

SharePoint 2010 and Powerpivot

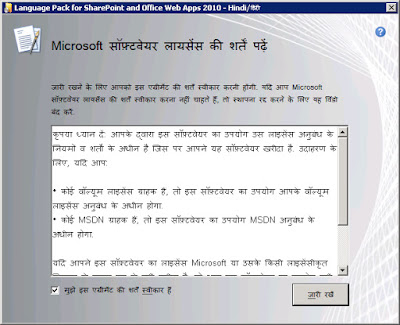
Sharepoint 2010 in Hindi

I am referring to mutli-linguistic feature of Sharepoint 2010.

You can have sites displayed to users in their own regional languages as long as it is approved by Microsoft. Follow these steps to setup in your environment.


For each language pack you will need to carry out below steps on each web servers. However, remember that every language install has unique name hence you will need to save this to separate folder to avoid overwrite of another language pack


Download language pack from http://www.microsoft.com/downloads/en/details.aspx?displaylang=en&FamilyID=046f16a9-4bce-4149-8679-223755560d54

Choose Hindi from below and hit Change button


Click on download in hindi


Run configuration wizard – will skip this (if you reading this that means you know what is this)


Once installed you will see the language ID installed 1081 for hindi %COMMONPROGRAMFILES%\Microsoft Shared\Web server extensions\14\LAYOUTS\Locale_ID


To verify this further, you can browse to below link at CA


Central Administration -> Upgrade and Migration -> Check product and patch installation status.


Special Thanks To : Jaspal, Amarprit

February 24, 2011

PowerPivot - New BI Solution

PowerPivot gives users the power to create compelling self-service BI solutions, facilitates sharing and collaboration on user-generated BI solutions in a Microsoft SharePoint Server 2010 environment, and enables IT organizations to increase operational efficiencies through Microsoft SQL Server 2008 R2-based management tools.

For More Information : http://www.powerpivot.com/